
We are renaming Browser Rendering to Browser Run. The name Browser Rendering never fully captured what the product does. Browser Run lets you run full browser sessions on Cloudflare's global network, drive them with code or AI, record and replay sessions, crawl pages for content, debug in real time, and let humans intervene when your agent needs help.
Along with the rename, we have increased limits for Workers Paid plans and redesigned the Browser Run dashboard.
We have 4x-ed concurrency limits for Workers Paid plan users:
- Concurrent browsers per account: 30 → 120 per account
- New browser instances: 30 per minute → 1 per second
- REST API rate limits: recently increased from 3 to 10 requests per second
Rate limits across the limits page are now expressed in per-second terms, matching how they are enforced. No action is needed to benefit from the higher limits.
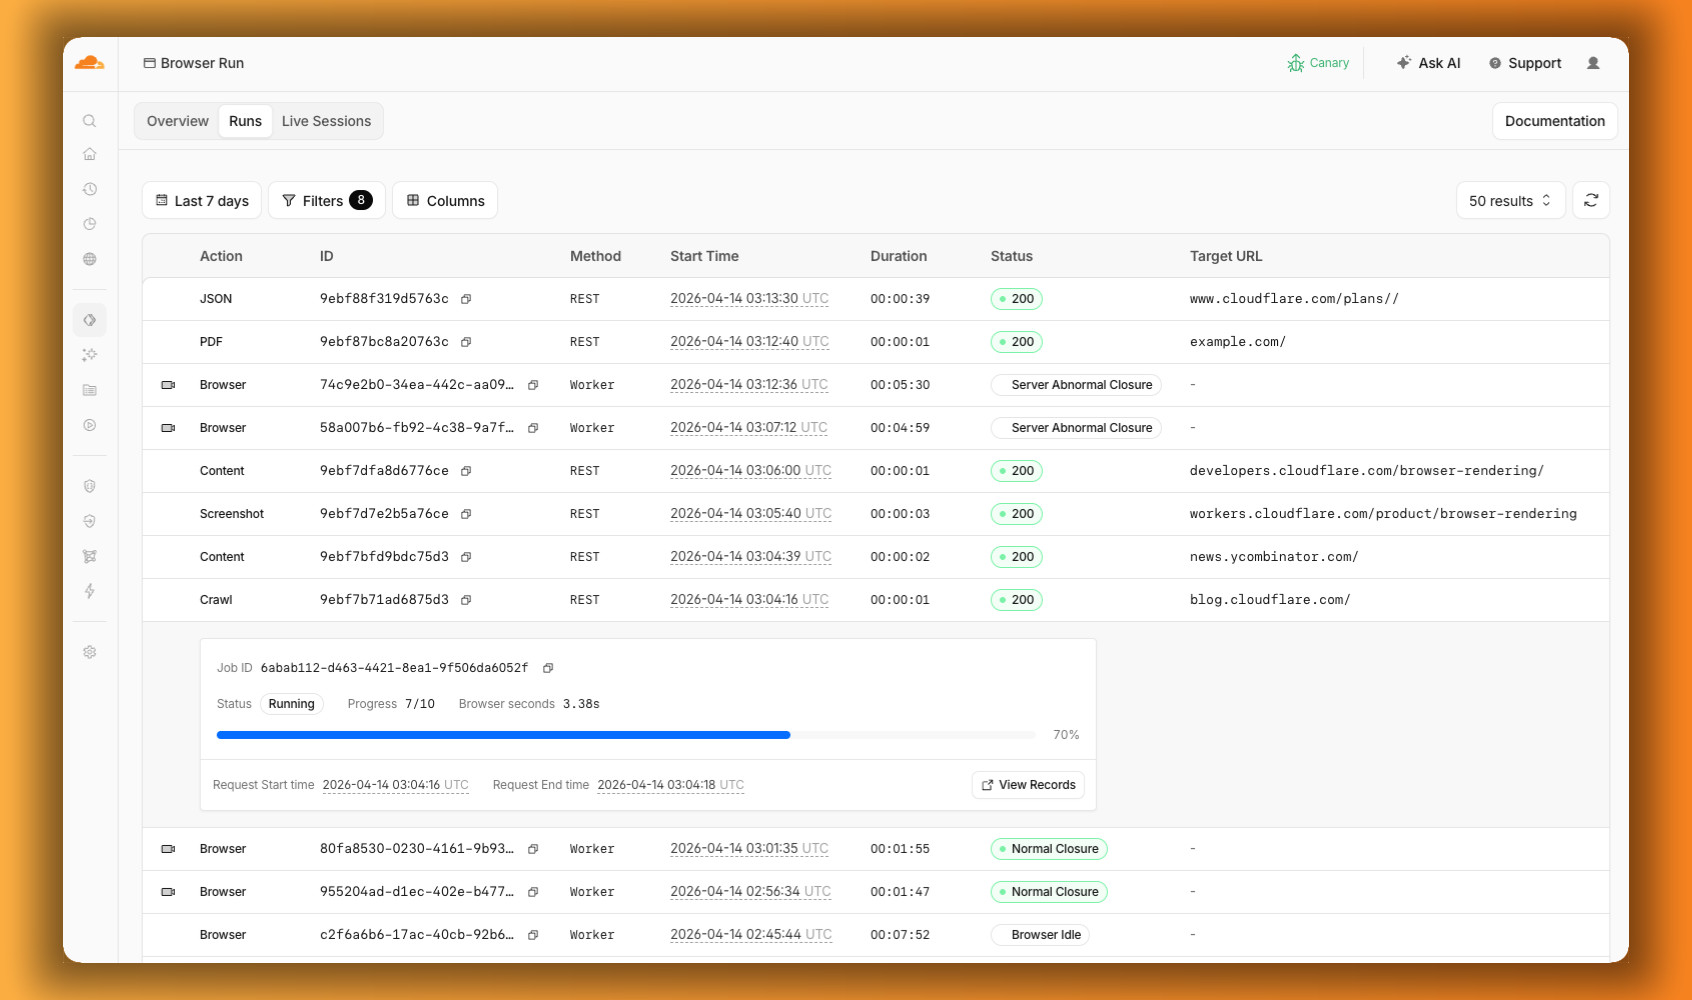
The redesigned dashboard ↗ now shows every request in a single Runs tab, not just browser sessions but also quick actions like screenshots, PDFs, markdown, and crawls. Filter by endpoint, view target URLs, status, and duration, and expand any row for more detail.
We are also shipping several new features:
- Live View, Human in the Loop, and Session Recordings - See what your agent is doing in real time, let humans step in when automation hits a wall, and replay any session after it ends.
- WebMCP - Websites can expose structured tools for AI agents to discover and call directly, replacing slow screenshot-analyze-click loops.
For the full story, read our Agents Week blog Browser Run: Give your agents a browser ↗.
When browser automation fails or behaves unexpectedly, it can be hard to understand what happened. We are shipping three new features in Browser Run (formerly Browser Rendering) to help:
- Live View for real-time visibility
- Human in the Loop for human intervention
- Session Recordings for replaying sessions after they end
Live View lets you see what your agent is doing in real time. The page, DOM, console, and network requests are all visible for any active browser session. Access Live View from the Cloudflare dashboard, via the hosted UI at
live.browser.run, or using native Chrome DevTools.When your agent hits a snag like a login page or unexpected edge case, it can hand off to a human instead of failing. With Human in the Loop, a human steps into the live browser session through Live View, resolves the issue, and hands control back to the script.
Today, you can step in by opening the Live View URL for any active session. Next, we are adding a handoff flow where the agent can signal that it needs help, notify a human to step in, then hand control back to the agent once the issue is resolved.
Session Recordings records DOM state so you can replay any session after it ends. Enable recordings by passing
recording: truewhen launching a browser. After the session closes, view the recording in the Cloudflare dashboard under Browser Run > Runs, or retrieve via API using the session ID. Next, we are adding the ability to inspect DOM state and console output at any point during the recording.
To get started, refer to the documentation for Live View, Human in the Loop, and Session Recording.
Browser Run (formerly Browser Rendering) now supports WebMCP ↗ (Web Model Context Protocol), a new browser API from the Google Chrome team.
The Internet was built for humans, so navigating as an AI agent today is unreliable. WebMCP lets websites expose structured tools for AI agents to discover and call directly. Instead of slow screenshot-analyze-click loops, agents can call website functions like
searchFlights()orbookTicket()with typed parameters, making browser automation faster, more reliable, and less fragile.
With WebMCP, you can:
- Discover website tools - Use
navigator.modelContextTesting.listTools()to see available actions on any WebMCP-enabled site - Execute tools directly - Call
navigator.modelContextTesting.executeTool()with typed parameters - Handle human-in-the-loop interactions - Some tools pause for user confirmation before completing sensitive actions
WebMCP requires Chrome beta features. We have an experimental pool with browser instances running Chrome beta so you can test emerging browser features before they reach stable Chrome. To start a WebMCP session, add
lab=trueto your/devtools/browserrequest:Terminal window curl -X POST "https://api.cloudflare.com/client/v4/accounts/{account_id}/browser-rendering/devtools/browser?lab=true&keep_alive=300000" \-H "Authorization: Bearer {api_token}"Combined with the recently launched CDP endpoint, AI agents can also use WebMCP. Connect an MCP client to Browser Run via CDP, and your agent can discover and call website tools directly. Here's the same hotel booking demo, this time driven by an AI agent through OpenCode:

For a step-by-step guide, refer to the WebMCP documentation.
- Discover website tools - Use
Cloudflare Access now supports independent multi-factor authentication (MFA), allowing you to enforce MFA requirements without relying on your identity provider (IdP). With per-application and per-policy configuration, you can enforce stricter authentication methods like hardware security keys on sensitive applications without requiring them across your entire organization. This reduces the risk of MFA fatigue for your broader user population while adding additional security where it matters most.
This feature also addresses common gaps in IdP-based MFA, such as inconsistent MFA policies across different identity providers or the need for additional security layers beyond what the IdP provides.
Independent MFA supports the following authenticator types:
- Authenticator application — Time-based one-time passwords (TOTP) using apps like Google Authenticator, Microsoft Authenticator, or Authy.
- Security key — Hardware security keys such as YubiKeys.
- Biometrics — Built-in device authenticators including Apple Touch ID, Apple Face ID, and Windows Hello.
You can configure MFA requirements at three levels:
Level Description Organization Enforce MFA by default for all applications in your account. Application Require or turn off MFA for a specific application. Policy Require or turn off MFA for users who match a specific policy. Settings at lower levels (policy) override settings at higher levels (organization), giving you granular control over MFA enforcement.
Users enroll their authenticators through the App Launcher. To help with onboarding, administrators can share a direct enrollment link:
<your-team-name>.cloudflareaccess.com/AddMfaDevice.To get started with Independent MFA, refer to Independent MFA.
-
We are excited to announce two major capability upgrades for Agent Lee, the AI co-pilot built directly into the Cloudflare dashboard. Agent Lee is designed to understand your specific account configuration, and with this release, it moves from a passive advisor to an active assistant that can help you manage your infrastructure and visualize your data through natural language.
Agent Lee can now perform changes on your behalf across your Cloudflare account. Whether you need to update DNS records, modify SSL/TLS settings, or configure Workers routes, you can simply ask.
To ensure security and accuracy, every write operation requires explicit user approval. Before any change is committed, Agent Lee will present a summary of the proposed action in plain language. No action is taken until you select Confirm, and this approval requirement is enforced at the infrastructure level to prevent unauthorized changes.
Example requests:
- "Add an A record for blog.example.com pointing to 192.0.2.10."
- "Enable Always Use HTTPS on my zone."
- "Set the SSL mode for example.com to Full (strict)."
Understanding your traffic and security trends is now as easy as asking a question. Agent Lee now features Generative UI, allowing it to render inline charts and structured data visualizations directly within the chat interface using your actual account telemetry.
Example requests:
- "Show me a chart of my traffic over the last 7 days."
- "What does my error rate look like for the past 24 hours?"
- "Graph my cache hit rate for example.com this week."
These features are currently available in Beta for all users on the Free plan. To get started, log in to the Cloudflare dashboard ↗ and select Ask AI in the upper right corner.
To learn more about how to interact with your account using AI, refer to the Agent Lee documentation.
The Cloudflare One dashboard now features redesigned builders for two core workflows: creating Gateway policies and configuring self-hosted Access applications.
The Gateway rule builder now features a redesigned user experience, bringing it in line with the Access policy builder experience. Improvements include:
- Streamlined UX with clearer states and improved user interactions
- Wirefilter editing for viewing and editing Gateway rules directly from wirefilter expressions
- Preview state to review the impact of your policy in a simple graphic
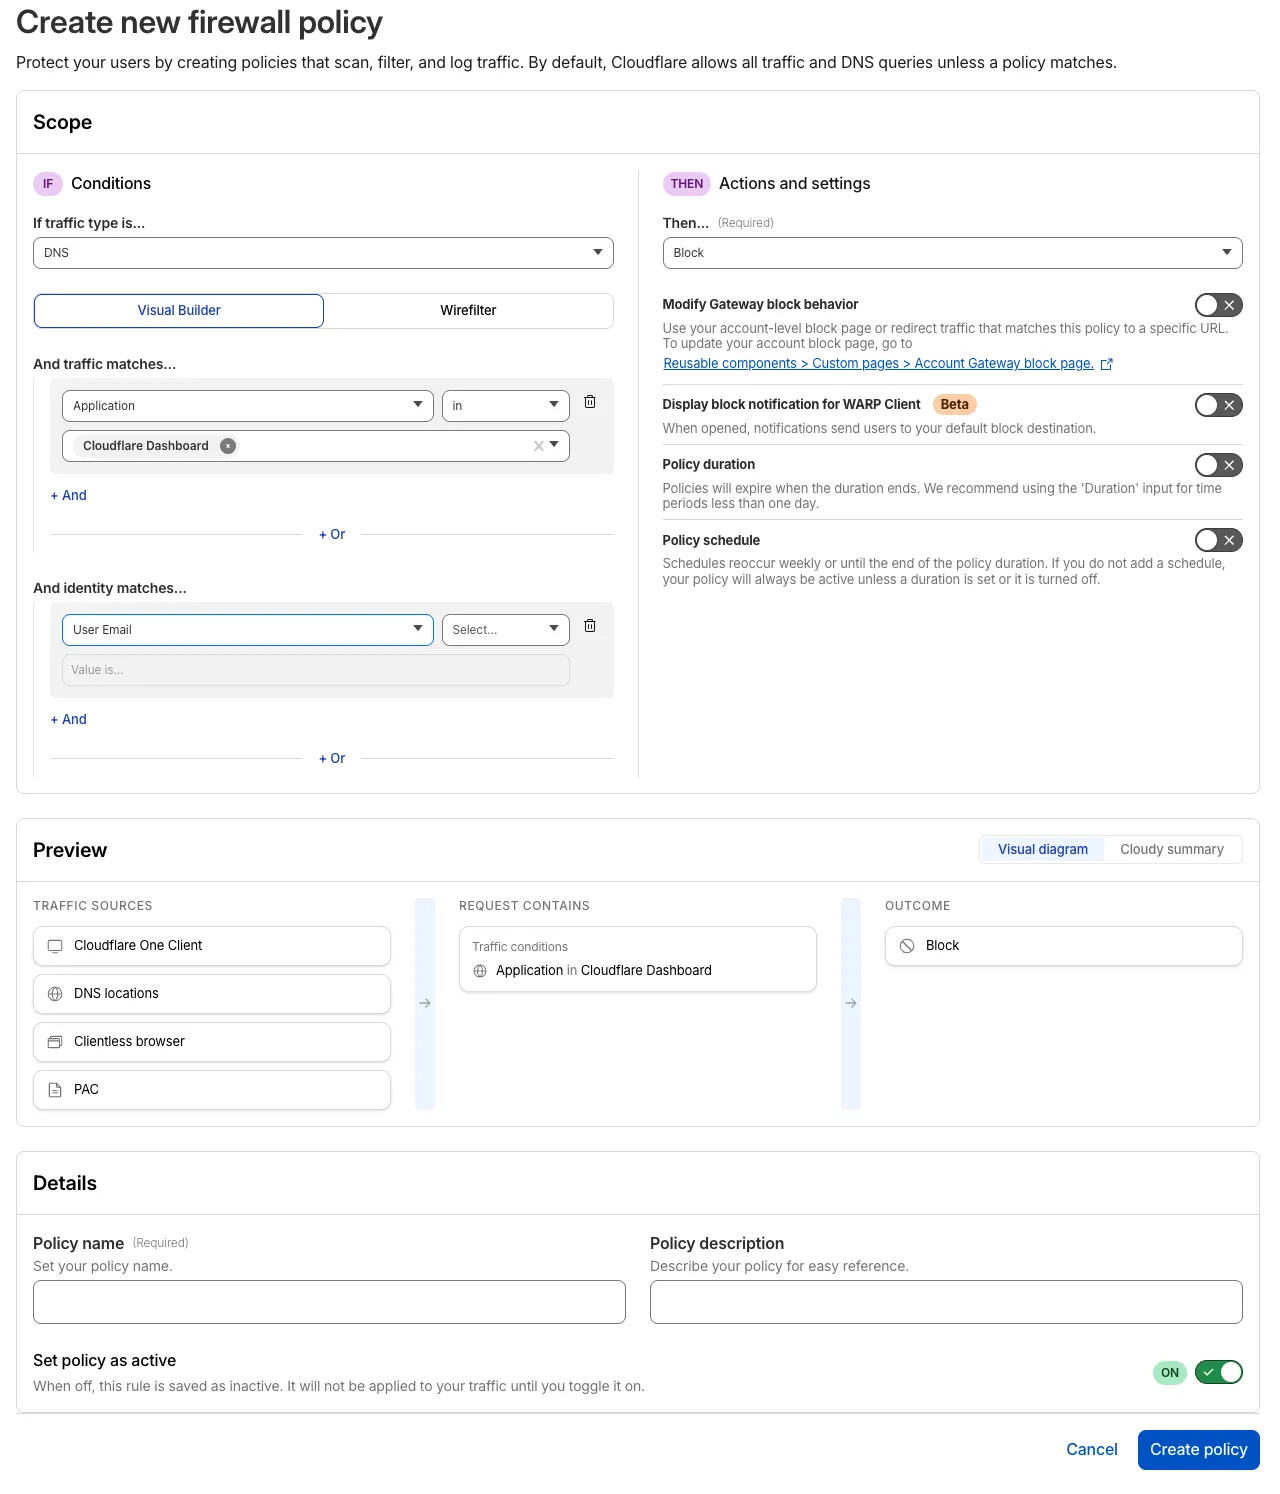
For more information, refer to Traffic policies.
The self-hosted Access application builder now offers a simplified creation workflow with fewer steps from setup to save. Improvements include:
- New application selection experience that makes choosing the right application type before you begin easier.
- Streamlined creation flow with fewer clicks to build and save an application
- Inline policy creation for building Access policies directly within the application creation flow
- Preview state to understand how your policies enforce user access before saving
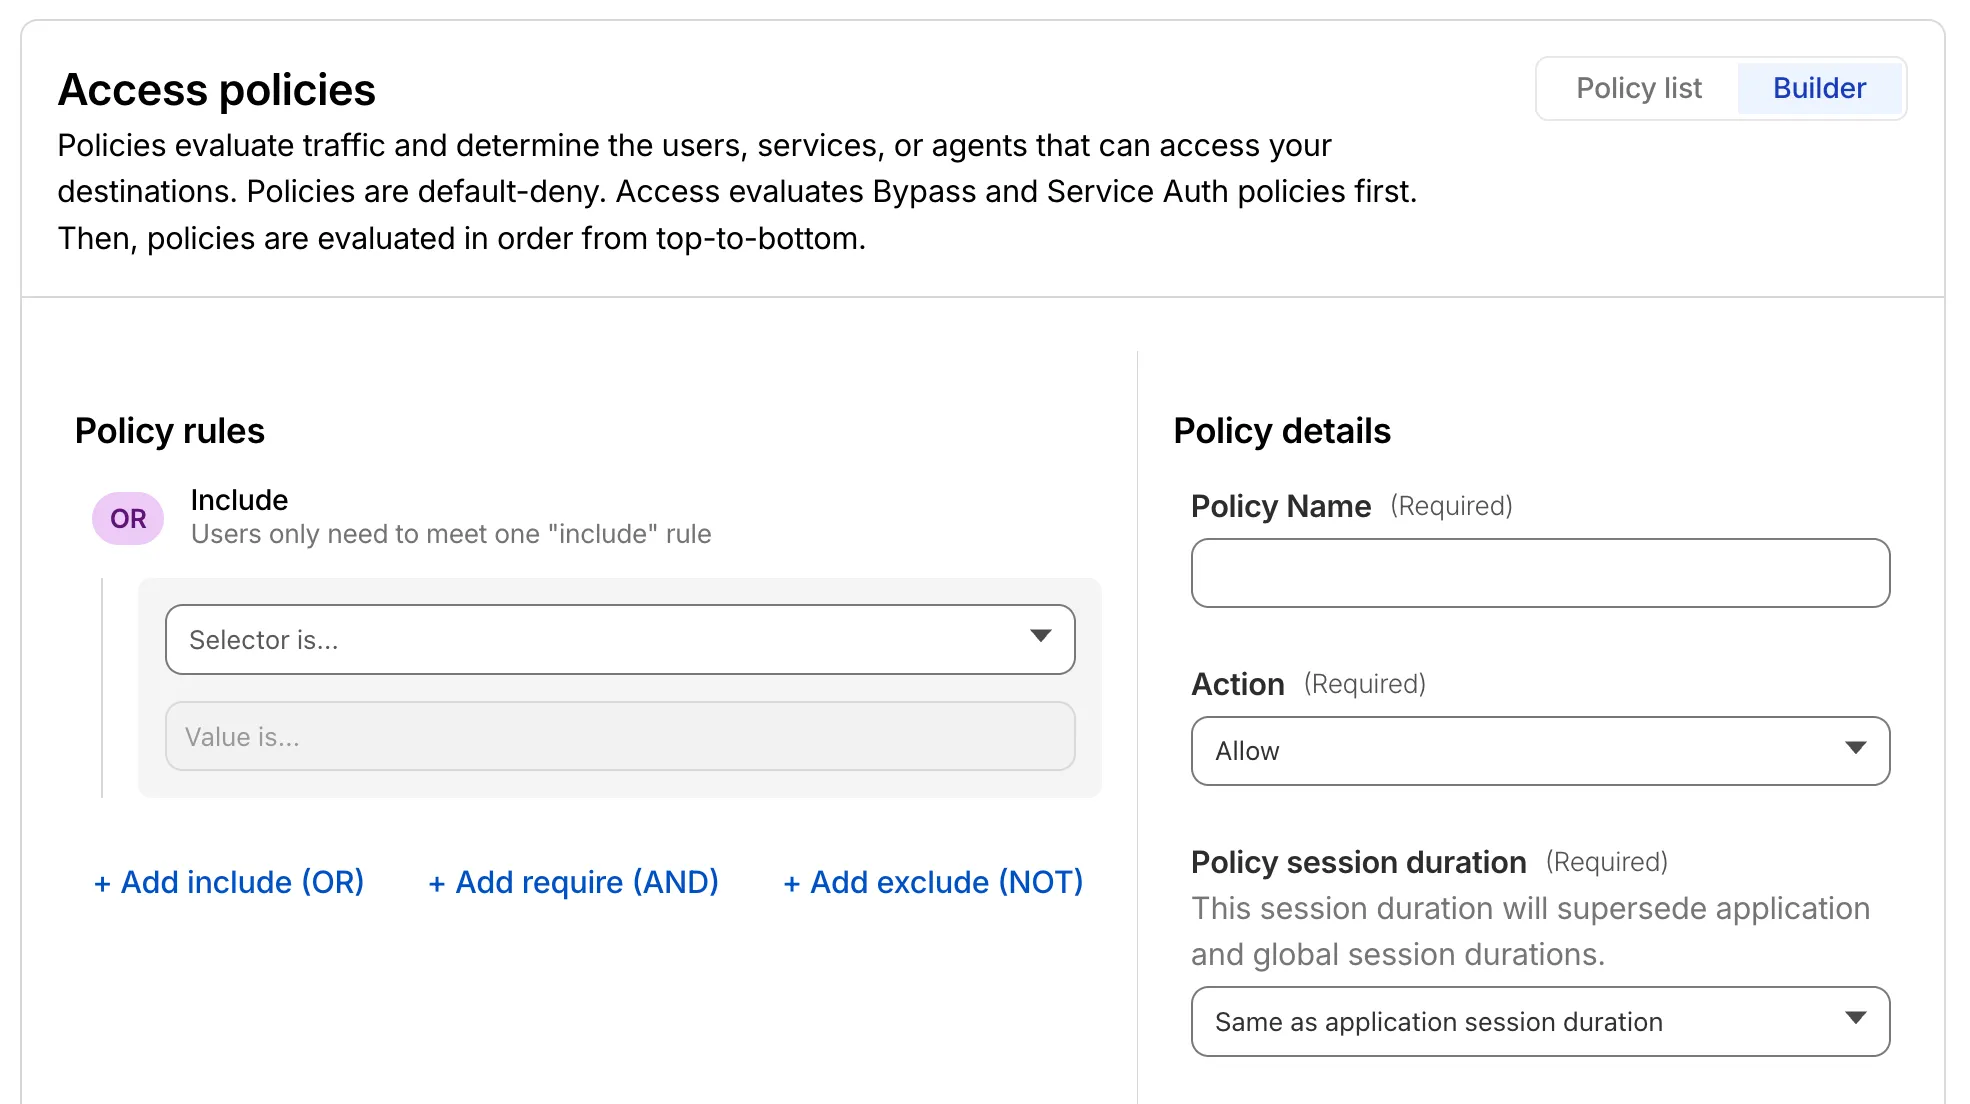
For more information, refer to self-hosted applications.
The last seen timestamp for Cloudflare One Client devices is now more consistent across the dashboard. IT teams will see more consistent information about the most recent client event between a device and Cloudflare's network.
Cloudflare has added new fields to multiple Logpush datasets:
The following Gateway and Zero Trust datasets now include a
TenantIDfield:- Gateway DNS: Identifies the tenant ID of the DNS request, if it exists.
- Gateway HTTP: Identifies the tenant ID of the HTTP request, if it exists.
- Gateway Network: Identifies the tenant ID of the network session, if it exists.
- Zero Trust Network Sessions: Identifies the tenant ID of the network session, if it exists.
The following datasets now include Firewall for AI fields:
-
FirewallForAIInjectionScore: The score indicating the likelihood of a prompt injection attack in the request.FirewallForAIPIICategories: List of PII categories detected in the request.FirewallForAITokenCount: The number of tokens in the request.FirewallForAIUnsafeTopicCategories: List of unsafe topic categories detected in the request.
For the complete field definitions for each dataset, refer to Logpush datasets.
Privacy Proxy metrics are now queryable through Cloudflare's GraphQL Analytics API, the new default method for accessing Privacy Proxy observability data. All metrics are available through a single endpoint:
Terminal window curl https://api.cloudflare.com/client/v4/graphql \--header "Authorization: Bearer <API_TOKEN>" \--header "Content-Type: application/json" \--data '{"query": "{ viewer { accounts(filter: { accountTag: $accountTag }) { privacyProxyRequestMetricsAdaptiveGroups(filter: { date_geq: $startDate, date_leq: $endDate }, limit: 10000, orderBy: [date_ASC]) { count dimensions { date } } } } }","variables": {"accountTag": "<YOUR_ACCOUNT_TAG>","startDate": "2026-04-04","endDate": "2026-04-06"}}'Four GraphQL nodes are now live, providing aggregate metrics across all key dimensions of your Privacy Proxy deployment:
privacyProxyRequestMetricsAdaptiveGroups— Request volume, error rates, status codes, and proxy status breakdowns.privacyProxyIngressConnMetricsAdaptiveGroups— Client-to-proxy connection counts, bytes transferred, and latency percentiles.privacyProxyEgressConnMetricsAdaptiveGroups— Proxy-to-origin connection counts, bytes transferred, and latency percentiles.privacyProxyAuthMetricsAdaptiveGroups— Authentication attempt counts by method and result.
All nodes support filtering by time, data center (
coloCode), and endpoint, with additional node-specific dimensions such as transport protocol and authentication method.OpenTelemetry-based metrics export remains available. The GraphQL Analytics API is now the recommended default method — a plug-and-play method that requires no collector infrastructure, saving engineering overhead.
This week's release introduces a new detection for a critical Remote Code Execution (RCE) vulnerability in Mesop (CVE-2026-33057), alongside protections for high-impact vulnerabilities in Cisco Secure Firewall Management Center (CVE-2026-20079) and FortiClient EMS (CVE-2026-21643). Additionally, this release includes an update to our existing React Server DoS coverage to address recently identified resource exhaustion vectors (CVE-2026-23869).
Key Findings
-
Cisco Secure FMC (CVE-2026-20079): A vulnerability in the web-based management interface of Cisco Secure Firewall Management Center (FMC) that allows an unauthenticated, remote attacker to execute arbitrary commands or bypass security filters.
-
FortiClient EMS (CVE-2026-21643): A critical vulnerability in the FortiClient EMS permitting unauthorized access or administrative configuration manipulation via crafted HTTP requests.
-
Mesop (CVE-2026-33057): A vulnerability in the Mesop Python-based UI framework where unauthenticated attackers can execute arbitrary code by sending specially crafted, Base64-encoded payloads in the request body.
Impact
Successful exploitation of these vulnerabilities could allow unauthenticated attackers to execute arbitrary code, gain administrative control over network management infrastructure, or trigger server-side resource exhaustion. Administrators are strongly encouraged to apply official vendor updates.
Ruleset Rule ID Legacy Rule ID Description Previous Action New Action Comments Cloudflare Managed Ruleset N/A Cisco Secure FMC - RCE via upgradeReadinessCall - CVE:CVE-2026-20079 Log Block This is a new detection. Cloudflare Managed Ruleset N/A FortiClient EMS - Pre-Auth SQL Injection - CVE:CVE-2026-21643 Log Block This is a new detection. Cloudflare Managed Ruleset N/A Mesop - Remote Code Execution - Base64 Payload - CVE:CVE-2026-33057 Log Block This is a new detection. Cloudflare Managed Ruleset N/A React Server - DOS - CVE:CVE-2026-23864 - 1 - Beta Log Block This rule has been merged into the original rule "React Server - DOS - CVE:CVE-2026-23864 - 1" (ID: Cloudflare Managed Ruleset N/A XSS, HTML Injection - Link Tag - URI (beta) N/A Disabled This is a new detection. Cloudflare Managed Ruleset N/A XSS, HTML Injection - Embed Tag - URI (beta) N/A Disabled This is a new detection. -
Account-level DLP settings are now available in Cloudflare One. You can now configure advanced DLP settings at the account level, including OCR, AI context analysis, and payload masking. This provides consistent enforcement across all DLP profiles and simplifies configuration management.
Key changes:
- Consistent enforcement: Settings configured at the account level apply to all DLP profiles
- Simplified migration: Settings enabled on any profile are automatically migrated to account level
- Deprecation notice: Profile-level advanced settings will be deprecated in a future release
Migration details:
During the migration period, if a setting is enabled on any profile, it will automatically be enabled at the account level. This means profiles that previously had a setting disabled may now have it enabled if another profile in the account had it enabled.
Settings are evaluated using OR logic - a setting is enabled if it is turned on at either the account level or the profile level. However, profile-level settings cannot be enabled when the account-level setting is off.
For more details, refer to the DLP settings documentation.
Browser Rendering now supports
wrangler browsercommands, letting you create, manage, and view browser sessions directly from your terminal, streamlining your workflow. Since Wrangler handles authentication, you do not need to pass API tokens in your commands.The following commands are available:
Command Description wrangler browser createCreate a new browser session wrangler browser closeClose a session wrangler browser listList active sessions wrangler browser viewView a live browser session The
createcommand spins up a browser instance on Cloudflare's network and returns a session URL. Once created, you can connect to the session using any CDP-compatible client like Puppeteer, Playwright, or MCP clients to automate browsing, scrape content, or debug remotely.Terminal window wrangler browser createUse
--keepAliveto set the session keep-alive duration (60-600 seconds):Terminal window wrangler browser create --keepAlive 300The
viewcommand auto-selects when only one session exists, or prompts for selection when multiple sessions are available.All commands support
--jsonfor structured output, and because these are CLI commands, you can incorporate them into scripts to automate session management.For full usage details, refer to the Wrangler commands documentation.
Cloudflare Mesh is now available (blog post ↗). Mesh connects your services and devices with post-quantum encrypted networking, allowing you to route traffic privately between servers, laptops, and phones over TCP, UDP, and ICMP.
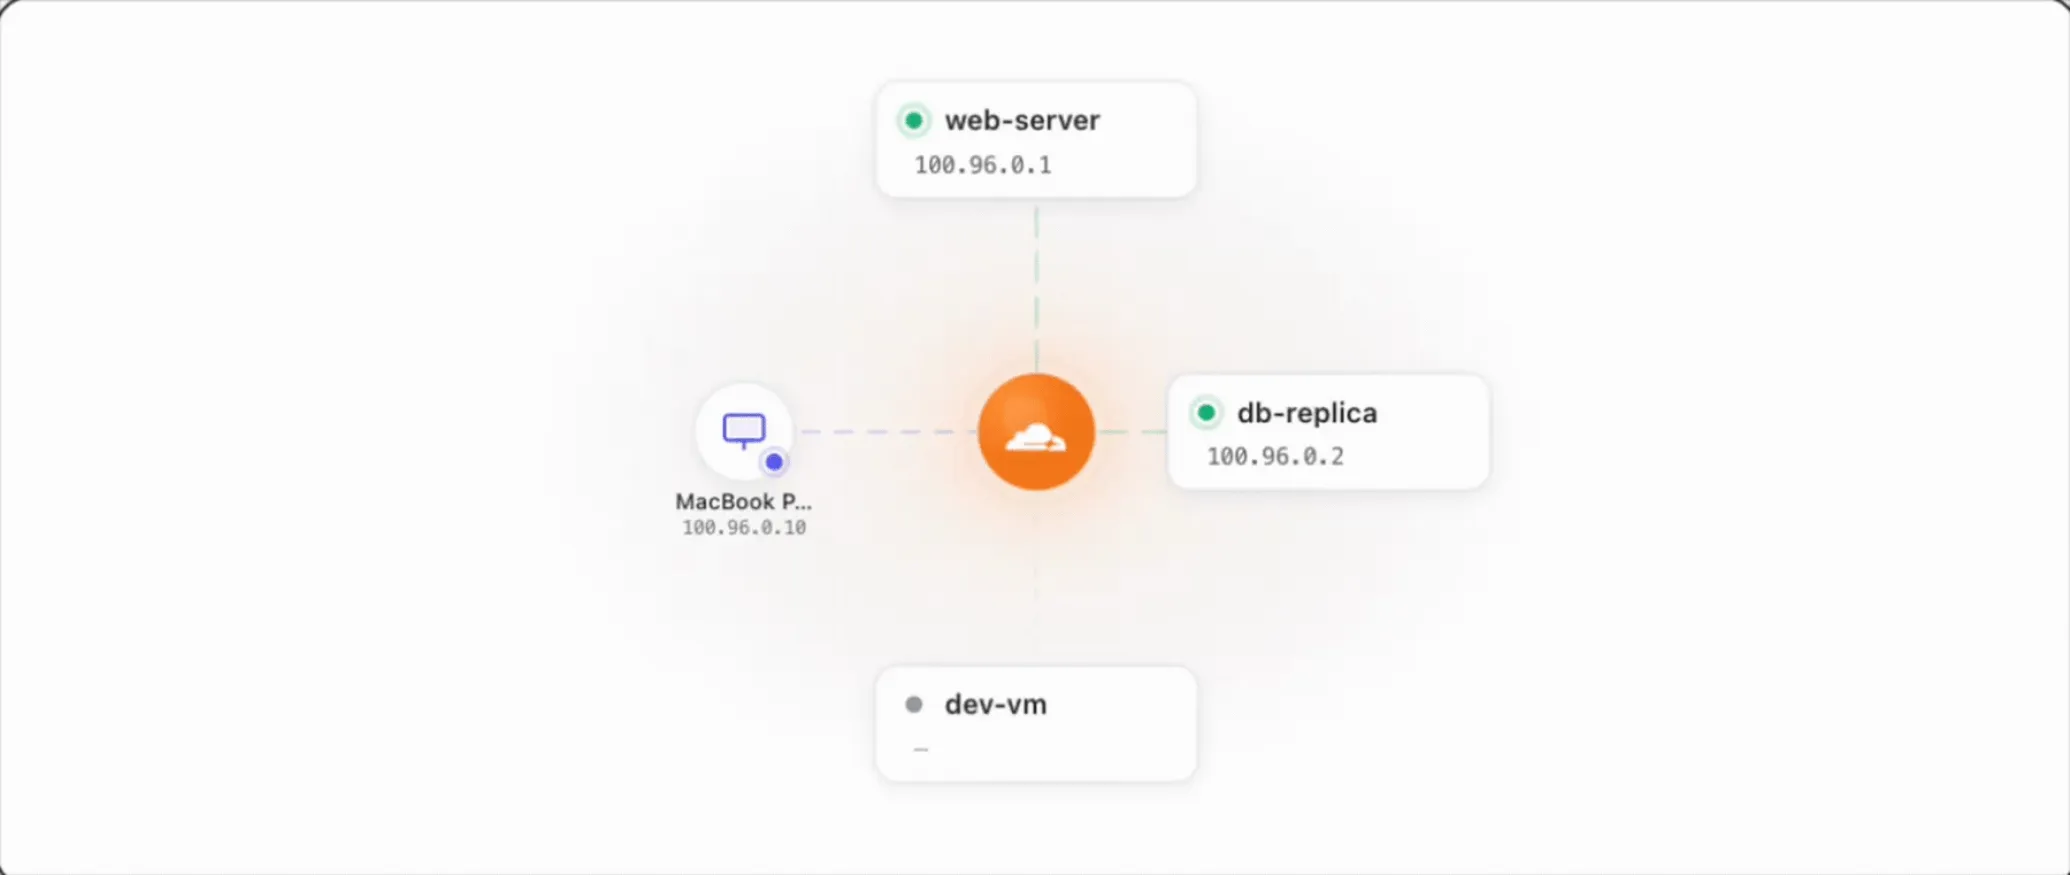
- Assigns a private Mesh IP to every enrolled device and node.
- Enables any participant to reach any other participant by IP — including client-to-client, without deploying any infrastructure.
- Supports CIDR routes for subnet routing through Mesh nodes.
- Supports high availability with active-passive replicas for nodes with routes.
- All traffic flows through Cloudflare, so Gateway network policies, device posture checks, and access rules apply to every connection.
- WARP Connector is now Cloudflare Mesh. Existing WARP Connectors are now called mesh nodes. All existing deployments continue to work — no migration required.
- Peer-to-peer connectivity is now called Mesh connectivity and is part of the Cloudflare Mesh documentation.
- Mesh node limit increased from 10 to 50 per account.
- New dashboard experience ↗ at Networking > Mesh with an interactive network map, node management, route configuration, diagnostics, and a setup wizard.
Refer to the Cloudflare Mesh documentation to set up your first Mesh network.
The Credentials and Secrets DLP profile now includes three new predefined entries for detecting Cloudflare API credentials:
Entry name Token prefix Detects Cloudflare User API Key cfk_User-scoped API keys Cloudflare User API Token cfut_User-scoped API tokens Cloudflare Account Owned API Token cfat_Account-scoped API tokens These detections target the new Cloudflare API credential format, which uses a structured prefix and a CRC32 checksum suffix. The identifiable prefix makes it possible to detect leaked credentials with high confidence and low false positive rates — no surrounding context such as
Authorization: Bearerheaders is required.Credentials generated before this format change will not be matched by these entries.
- In the Cloudflare dashboard ↗, go to Zero Trust > DLP > DLP Profiles.
- Select the Credentials and Secrets profile.
- Turn on one or more of the new Cloudflare API token entries.
- Use the profile in a Gateway HTTP policy to log or block traffic containing these credentials.
Example policy:
Selector Operator Value Action DLP Profile in Credentials and Secrets Block You can also enable individual entries to scope detection to specific credential types — for example, enabling Account Owned API Token detection without enabling User API Key detection.
For more information, refer to predefined DLP profiles.
You can now configure how sensitive data matches are displayed in your DLP payload match logs — giving your incident response team the context they need to validate alerts without compromising your security posture.
To get started, go to the Cloudflare dashboard ↗, select Zero Trust > Data loss prevention > DLP settings and find the Payload log masking card.
Previously, all DLP payload logs used a single masking mode that obscured matched data entirely and hid the original character count, making it difficult to distinguish true positives from false positives. This update introduces three options:
- Full Mask (default): Masks the match while preserving character count and visual formatting (for example,
***-**-****for a Social Security Number). This is an improvement over the previous default, which did not preserve character count. - Partial Mask: Reveals 25% of the matched content while masking the remainder (for example,
***-**-6789). - Clear Text: Stores the full, unmasked violation for deep investigation (for example,
123-45-6789).
Important: The masking level you select is applied at detection time, before the payload is encrypted. This means the chosen format is what your team will see after decrypting the log with your private key — the existing encryption workflow is unchanged.
Applies to all enabled detections: When a masking level other than Full Mask is selected, it applies to all sensitive data matches found within a payload window — not just the match that triggered the policy. Any data matched by your enabled DLP detection entries will be masked at the selected level.
For more information, refer to DLP logging options.
- Full Mask (default): Masks the match while preserving character count and visual formatting (for example,
OAuth allows third-party applications to access your Cloudflare account on your behalf — like when Wrangler deploys Workers or when monitoring tools read your analytics. You now have granular control over which accounts these applications can access, plus the ability to revoke access anytime.
When authorizing an OAuth application, you can now select specific accounts instead of granting access to all your accounts:
- Account-by-account selection — Choose exactly which accounts the application can access
- "All accounts" option — Still available for trusted tools like Wrangler This gives you precise control who can access your data.
The OAuth consent screen now shows:
- What the application can access — Explicit list of permissions being requested
- Who created the application — Application owner and contact information
- Which accounts you're authorizing — Checkboxes for account selection
Manage authorized OAuth applications from your profile:
- See all connected apps — View every OAuth application with access to your accounts
- Review permissions and scope — Check what each application can do and which accounts it can access
- Revoke instantly — Remove access with one click when you no longer need it To manage your OAuth applications, navigate to Profile > Access Management > Connected Applications ↗.
These updates give you:
- Granular control — Authorize apps per-account instead of all-or-nothing
- Transparency — Know exactly what you're authorizing before you consent
- Security — Limit blast radius by restricting access to only necessary accounts
- Easy cleanup — Revoke access when applications are no longer needed
Read more about these improvements in our blog post: Improving the OAuth consent experience ↗.
You can now configure Logpush jobs to Google BigQuery directly from the Cloudflare dashboard, in addition to the existing API-based setup.
Previously, setting up a BigQuery Logpush destination required using the Logpush API. Now you can create and manage BigQuery Logpush jobs from the Logpush page in the Cloudflare dashboard by selecting Google BigQuery as the destination and entering your Google Cloud project ID, dataset ID, table ID, and service account credentials.
For more information, refer to Enable Logpush to Google BigQuery.
Radar shareable widgets now include a generate citation action, making it easier to reference Cloudflare Radar ↗ data in research papers and other publications.
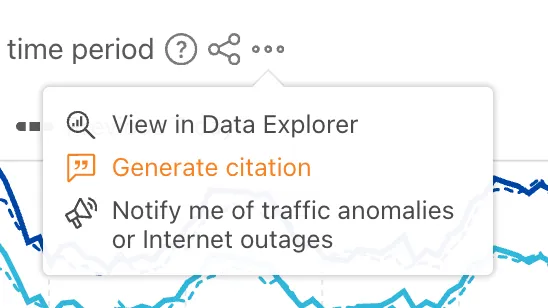
Select the citation icon to open a modal with five supported citation styles:
- BibTeX
- APA
- MLA
- Chicago
- RIS
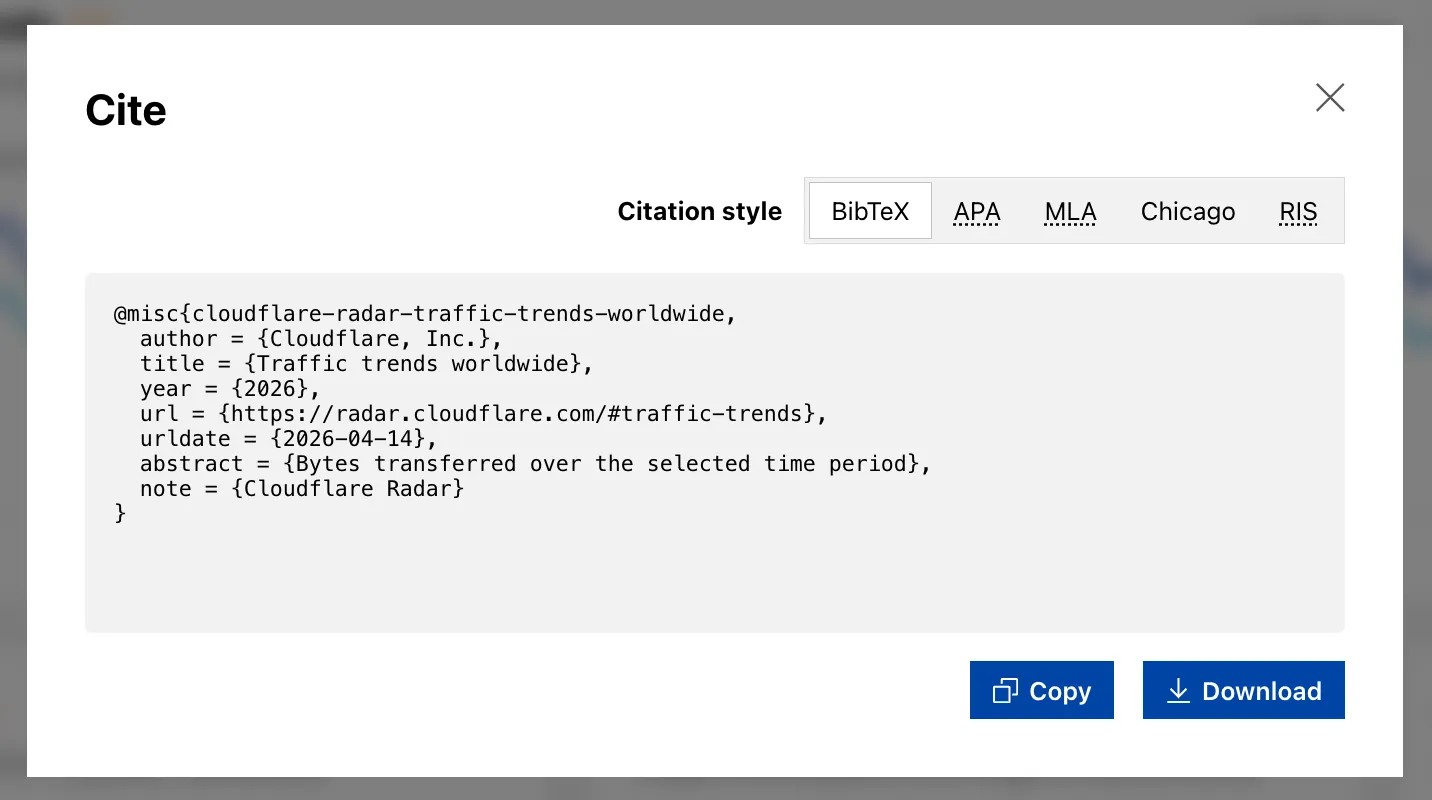
Explore the feature on any shareable widget at Cloudflare Radar ↗.
The decode script injected by Email Address Obfuscation now loads with the
deferattribute. This means the script no longer blocks page rendering. It downloads in parallel with HTML parsing and executes after the document is fully parsed, before theDOMContentLoadedevent.This improves page loading performance, contributing to better Core Web Vitals, for all zones with Email Address Obfuscation on. No action is required.
If you have custom JavaScript that depends on email addresses being decoded at a specific point during page load, note that the decode script now executes after HTML parsing completes rather than inline during parsing.
VPC Network bindings now give your Workers access to any service in your private network without pre-registering individual hosts or ports. This complements existing VPC Service bindings, which scope each binding to a specific host and port.
You can bind to a Cloudflare Tunnel by
tunnel_idto reach any service on the network where that tunnel is running, or bind to your Cloudflare Mesh network usingcf1:networkto reach any Mesh node, client device, or subnet route in your account:JSONC {"vpc_networks": [{"binding": "MESH","network_id": "cf1:network","remote": true}]}TOML [[vpc_networks]]binding = "MESH"network_id = "cf1:network"remote = trueAt runtime,
fetch()routes through the network to reach the service at the IP and port you specify:JavaScript const response = await env.MESH.fetch("http://10.0.1.50:8080/api/data");For configuration options and examples, refer to VPC Networks and Connect Workers to Cloudflare Mesh.
Cloudflare Containers and Sandboxes are now generally available.
Containers let you run more workloads on the Workers platform, including resource-intensive applications, different languages, and CLI tools that need full Linux environments.
Since the initial launch of Containers, there have been significant improvements to Containers' performance, stability, and feature set. Some highlights include:
- Higher limits allow you to run thousands of containers concurrently.
- Active-CPU pricing means that you only pay for used CPU cycles.
- Easy connections to Workers and other bindings via hostnames help you extend your Containers with additional functionality.
- Docker Hub support makes it easy to use your existing images and registries.
- SSH support helps you access and debug issues in live containers.
The Sandbox SDK provides isolated environments for running untrusted code securely, with a simple TypeScript API for executing commands, managing files, and exposing services. This makes it easier to secure and manage your agents at scale. Some additions since launch include:
- Live preview URLs so agents can run long-lived services and verify in-flight changes.
- Persistent code interpreters for Python, JavaScript, and TypeScript, with rich structured outputs.
- Interactive PTY terminals for real browser-based terminal access with multiple isolated shells per sandbox.
- Backup and restore APIs to snapshot a workspace and quickly restore an agent's coding session without repeating expensive setup steps.
- Real-time filesystem watching so apps and agents can react immediately to file changes inside a sandbox.
For more information, refer to Containers and Sandbox SDK documentation.
Outbound Workers for Sandboxes and Containers now support zero-trust credential injection, TLS interception, allow/deny lists, and dynamic per-instance egress policies. These features give platforms running agentic workloads full control over what leaves the sandbox, without exposing secrets to untrusted workloads, like user-generated code or coding agents.
Because outbound handlers run in the Workers runtime, outside the sandbox, they can hold secrets the sandbox never sees. A sandboxed workload can make a plain request, and credentials are transparently attached before a request is forwarded upstream.
For instance, you could run an agent in a sandbox and ensure that any requests it makes to Github are authenticated. But it will never be able to access the credentials:
TypeScript export class MySandbox extends Sandbox {}MySandbox.outboundByHost = {"github.com": (request: Request, env: Env, ctx: OutboundHandlerContext) => {const requestWithAuth = new Request(request);requestWithAuth.headers.set("x-auth-token", env.SECRET);return fetch(requestWithAuth);},};You can easily inject unique credentials for different instances by using
ctx.containerId:TypeScript MySandbox.outboundByHost = {"my-internal-vcs.dev": async (request: Request,env: Env,ctx: OutboundHandlerContext,) => {const authKey = await env.KEYS.get(ctx.containerId);const requestWithAuth = new Request(request);requestWithAuth.headers.set("x-auth-token", authKey);return fetch(requestWithAuth);},};No token is ever passed into the sandbox. You can rotate secrets in the Worker environment and every request will pick them up immediately.
Outbound Workers now intercept HTTPS traffic. A unique ephemeral certificate authority (CA) and private key are created for each sandbox instance. The CA is placed into the sandbox and trusted by default. The ephemeral private key never leaves the container runtime sidecar process and is never shared across instances.
With TLS interception active, outbound Workers can act as a transparent proxy for both HTTP and HTTPS traffic.
Easily filter outbound traffic with
allowedHostsanddeniedHosts. WhenallowedHostsis set, it becomes a deny-by-default allowlist. Both properties support glob patterns.TypeScript export class MySandbox extends Sandbox {allowedHosts = ["github.com", "npmjs.org"];}Define named outbound handlers then apply or remove them at runtime using
setOutboundHandler()orsetOutboundByHost(). This lets you change egress policy for a running sandbox without restarting it.TypeScript export class MySandbox extends Sandbox {}MySandbox.outboundHandlers = {allowHosts: async (req: Request, env: Env, ctx: OutboundHandlerContext ) => {const url = new URL(req.url);if (ctx.params.allowedHostnames.includes(url.hostname)) {return fetch(req);}return new Response(null, { status: 403 });},noHttp: async () => {return new Response(null, { status: 403 });},};Apply handlers programmatically from your Worker:
TypeScript const sandbox = getSandbox(env.Sandbox, userId);// Open network for setupawait sandbox.setOutboundHandler("allowHosts", {allowedHostnames: ["github.com", "npmjs.org"],});await sandbox.exec("npm install");// Lock down after setupawait sandbox.setOutboundHandler("noHttp");Handlers accept
params, so you can customize behavior per instance without defining separate handler functions.Upgrade to
@cloudflare/containers@0.3.0or@cloudflare/sandbox@0.8.9to use these features.For more details, refer to Sandbox outbound traffic and Container outbound traffic.
Local Explorer is a browser-based interface and REST API for viewing and editing local resource data during development. It removes the need to write throwaway scripts or dig through
.wrangler/stateto understand what data your Worker has stored locally.Local Explorer is available in Wrangler 4.82.1+ and the Cloudflare Vite plugin 1.32.0+. Start a local development session and press
ein your terminal, or navigate to/cdn-cgi/exploreron your local dev server.Local Explorer supports five resource types and works across multiple workers running locally:
- KV — Browse keys, view values and metadata, create, update, and delete key-value pairs.
- R2 — List objects, view metadata, upload files, and delete objects. Supports directory views and multi-select.
- D1 — Browse tables and rows, run arbitrary SQL queries, and edit schemas in a full data studio.
- Durable Objects (SQLite storage) — Browse individual object SQLite tables, run SQL queries, and edit schemas.
- Workflows — List instances, view status and step history, trigger new runs, and pause, resume, restart, or terminate instances.
Local Explorer exposes a REST API at
/cdn-cgi/explorer/apithat provides programmatic access to the same operations available in the browser. The root endpoint returns an OpenAPI specification ↗ describing all available endpoints, parameters, and response formats.Terminal window curl http://localhost:8787/cdn-cgi/explorer/apiPoint an AI coding agent at
/cdn-cgi/explorer/apiand it can discover and interact with your local resources without manual setup. This enables iterative development loops where an agent can populate test data in KV or D1, inspect Durable Object state, trigger Workflow runs, or upload files to R2.For more details, refer to the Local Explorer documentation.
Remote Browser Isolation now supports Canvas Remoting, improving performance for HTML5 Canvas applications by sending vector draw commands instead of rasterized bitmaps.
- 10x bandwidth reduction: Microsoft Word and other Office apps use 90% less bandwidth
- Smooth performance: Google Sheets maintains consistent 30fps rendering
- Responsive terminals: Web-based development environments and AI notebooks work in real-time
- Zero configuration: Enabled by default for all Browser Isolation customers
Instead of sending rasterized bitmaps for every Canvas update, Browser Isolation now:
- Captures Canvas draw commands at the source
- Converts them to lightweight vector instructions
- Renders Canvas content on the client
This reduces bandwidth from hundreds of kilobytes per second to tens of kilobytes per second.
To temporarily disable for troubleshooting:
- Right-click the isolated webpage background
- Select Disable Canvas Remoting
- Re-enable the same way by selecting Enable Canvas Remoting
Currently supports 2D Canvas contexts only. WebGL and 3D graphics applications continue using bitmap rendering. For more information, refer to Canvas Remoting.
Browser Rendering now exposes the Chrome DevTools Protocol (CDP), the low-level protocol that powers browser automation. The growing ecosystem of CDP-based agent tools, along with existing CDP automation scripts, can now use Browser Rendering directly.
Any CDP-compatible client, including Puppeteer and Playwright, can connect from any environment, whether that is Cloudflare Workers, your local machine, or a cloud environment. All you need is your Cloudflare API key.
For any existing CDP script, switching to Browser Rendering is a one-line change:
JavaScript const puppeteer = require("puppeteer-core");const browser = await puppeteer.connect({browserWSEndpoint: `wss://api.cloudflare.com/client/v4/accounts/${ACCOUNT_ID}/browser-rendering/devtools/browser?keep_alive=600000`,headers: { Authorization: `Bearer ${API_TOKEN}` },});const page = await browser.newPage();await page.goto("https://example.com");console.log(await page.title());await browser.close();Additionally, MCP clients like Claude Desktop, Claude Code, Cursor, and OpenCode can now use Browser Rendering as their remote browser via the chrome-devtools-mcp ↗ package.
Here is an example of how to configure Browser Rendering for Claude Desktop:
{"mcpServers": {"browser-rendering": {"command": "npx","args": ["-y","chrome-devtools-mcp@latest","--wsEndpoint=wss://api.cloudflare.com/client/v4/accounts/<ACCOUNT_ID>/browser-rendering/devtools/browser?keep_alive=600000","--wsHeaders={\"Authorization\":\"Bearer <API_TOKEN>\"}"]}}}To get started, refer to the CDP documentation.